※ Latest version: StylePix , StylePix Pro
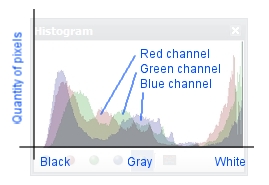
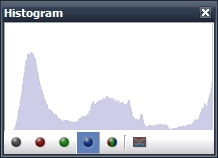
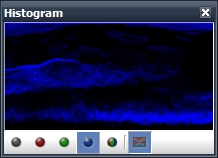
The histogram shows quantity of pixels in image as a graph. The horizontal axis of the graph represents tone and the vertical axis represents quantity. The left side of the horizontal axis represents the dark areas and the right hand side represents pure white areas.
To display the histogram, choose .
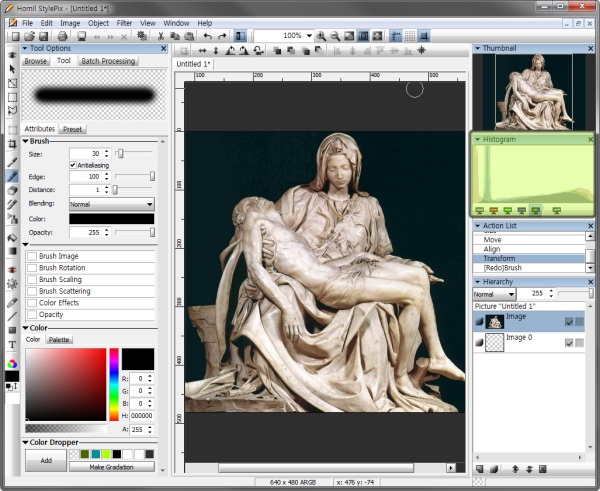
The below sample image shows analysis target image and it's histogram and waveform.
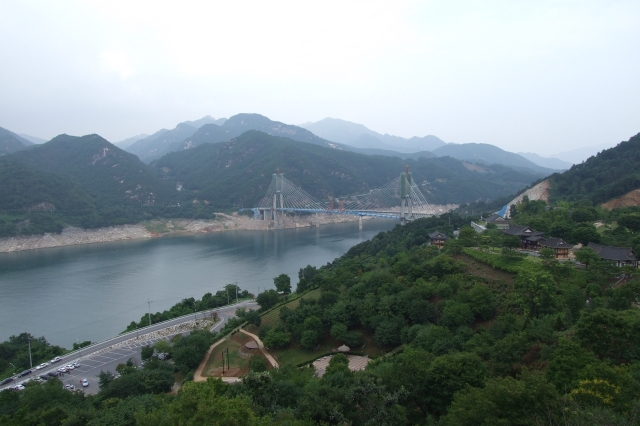
Analysis target
|
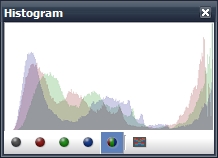
Histogram
|
|
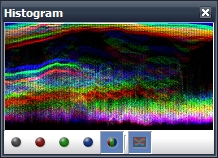
Waveform
|
An RGB image has three channels: red, green and blue. If you want to see the histogram of each channel, press the button of histogram toolbar.
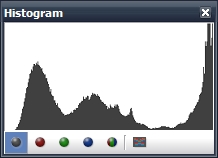
Mono
|
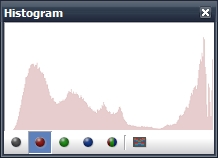
Red
|
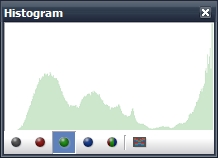
Green
|
Blue
|
The waveform shows quantity of pixels in image as a graph unlike the histogram. The horizontal axis of the graph represents width of image and the vertical axis represents quantity of pixels.
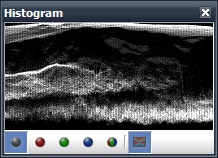
Mono
|
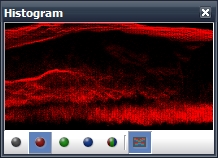
Red
|
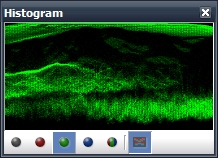
Green
|
Blue
|